At present, when we hear about API monitoring, generally we perceive a server-side monitoring system. But as API performance is taking a center stage in user experience, it is very important that we analyze what concerns end-users are facing and get the affected list of users. In this article, we’ll discuss the code integrations and how to set the reporting and user list for it.
TL;DROn the front end side of application, you need to get the time before API is called and once you receive the response take time difference and other relevant information. Then call a custom “Fibo.setEvent()” function.
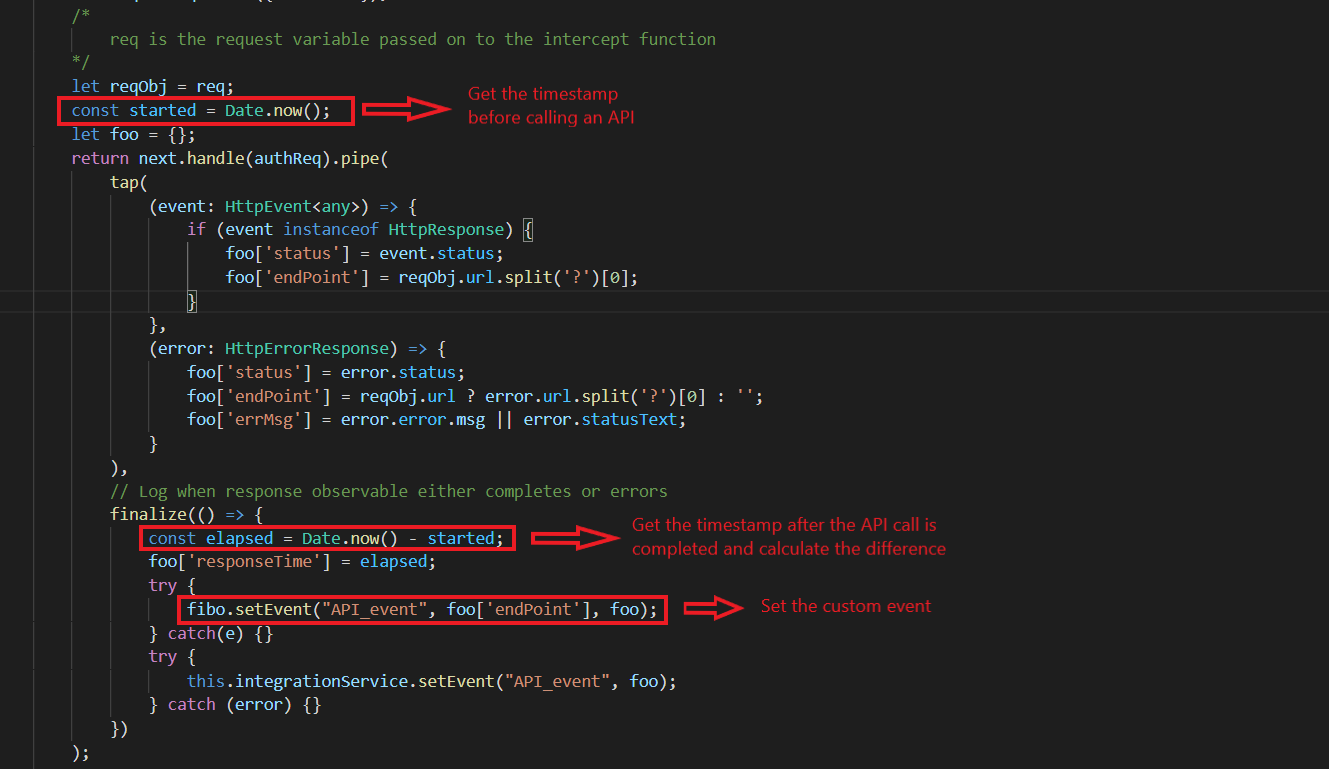
API response latency can be simply measured by calculating the timestamp difference between the instance at which the API call is being done and response is received.
E.g- In angular app you can easily use interceptor for the same.

/*
  req is the request variable passed on to the intercept function
*/
let reqObj = req;
const started = Date.now();
let foo = {};
return next.handle(authReq).pipe(
    tap(
       (event: HttpEvent<any>) => {
            if (event instanceof HttpResponse) {
                foo['status'] = event.status;
                foo['endPoint'] = reqObj.url.split('?')[0];
             }
        },
        (error: HttpErrorResponse) => {
            foo['status'] = error.status;
            foo['endPoint'] = reqObj.url ? error.url.split('?')[0] : '';
            foo['errMsg'] = error.error.msg || error.statusText;
        }
    ),
    // Log when response observable either completes or errors
    finalize(() => {
        const elapsed = Date.now() - started;
        foo['responseTime'] = elapsed;
        try {
            fibo.setEvent("API_event", foo['endPoint'], foo);
        } catch(e) {}
    })
);
the foo object here contains: { status: <status_code>, responseTime: <API response time>, endPoint: <API URL endpoint>, errMsg: <error message when error happens> }
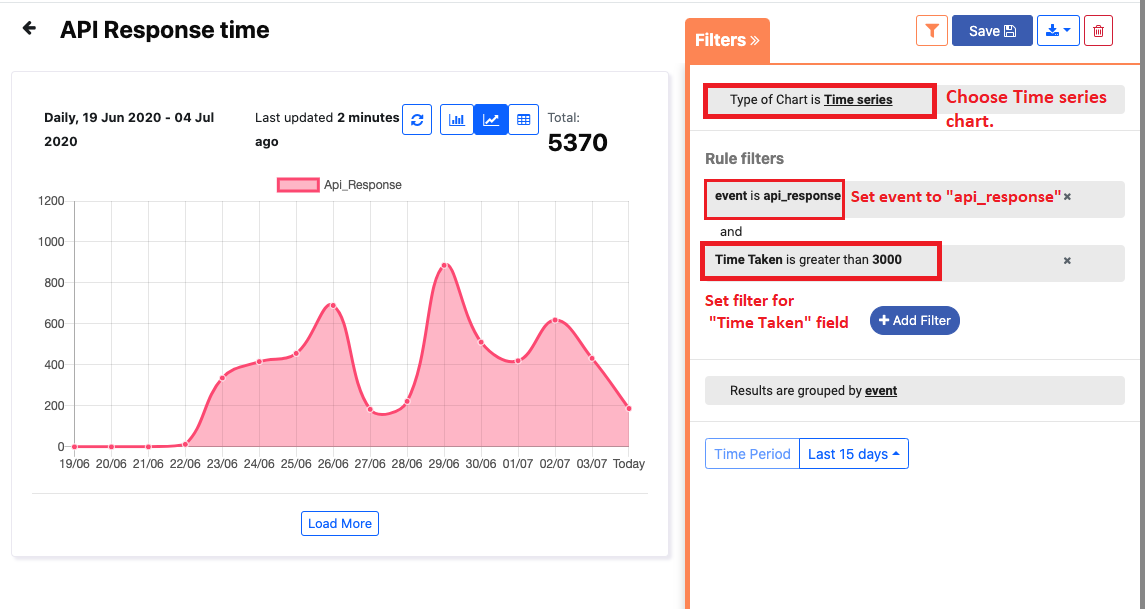
In the fibotalk application, you can create a “Time series” chart to analyze the API latency and perform other desired analysis for the same.

Please drop a mail at support@fibotalk.com if you have any questions.
